Best ADX Trading Books to Buy in November 2025
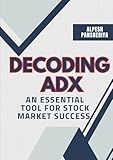
Decoding ADX: An Essential Tool for Stock Market Success (Pro Trader Advanced Strategy and Next Level Special Indicators Series-3)


Buy High Sell Higher: Day Trading using High-Low Moving Average, MACD, ADX/DMI & Chaikin Volatility Indicator


SURE SHOT MONEY TRADING STRATEGY USING TRIPLE EXPONENTIAL MOVING AVERAGE (TEMA), QQE (QUALITATIVE QUANTITATIVE ESTIMATION) INDICATOR AND ADX/DMI


BREAKOUT TRADING STRATEGY - ANALYZING STOCKS USING TTM SQUEEZE, KAIRI RELATIVE INDEX & ADX/DMI


Forex & Crypto Day Trading Strategy combining Qstick Indicator, ADX, Money Flow Index & ATR Trailing Stops


SHORT SELLING DAY TRADING TECHNIQUE USING DOUBLE SUPERTREND, MACD & ADX


The Average Directional Index (ADX) is a technical indicator used in the field of technical analysis to determine the strength of a prevailing trend. It was developed by J. Welles Wilder and is commonly used to identify the overall strength of a market trend, regardless of its direction (upward or downward).
The ADX is calculated based on a series of calculations involving the positive and negative directional movement indicators (DMI) which are derived from the price action of an asset. The ADX is expressed as a single line value, ranging between 0 and 100.
Interpreting the ADX involves understanding two main components: the ADX reading and the directional movement indicators, namely the +DI and -DI lines. The ADX reading is used to gauge the strength of the trend, while the +DI and -DI lines help determine the direction of the trend.
When the ADX reading is below 20, it suggests a weak or non-existent trend, indicating a period of consolidation or a sideways market. Traders may interpret this as a signal to avoid trading or to focus on other technical indicators.
When the ADX reading is between 20 and 40, it indicates a developing trend. Traders may consider the trend to be moderate or gaining strength. This is often seen as a potential entry point for trades in the direction of the trend.
When the ADX reading is above 40, it signifies a strong trend. Traders may interpret this as a signal that the trend is well-established and likely to continue. It is often considered a good opportunity for trend-following trades.
It is important to note that the ADX does not provide information about the direction of the trend but rather focuses on its strength. To determine the trend direction, traders analyze the +DI and -DI lines. When the +DI line is above the -DI line, it suggests an upward trend, and vice versa for a downward trend.
Overall, the Average Directional Index is a useful tool for traders to assess the strength of a trend and make informed decisions. However, it is often used in conjunction with other technical indicators to develop a comprehensive trading strategy.
How to use Average Directional Index (ADX) in technical analysis?
The Average Directional Index (ADX) is a widely used technical indicator that measures the strength of a trend, regardless of its direction. It helps traders identify whether a security is trending or in a range-bound phase. Here are the steps to use ADX in technical analysis:
- Understanding the ADX reading: ADX values range from 0 to 100. Typically, a reading above 25 indicates the presence of a strong trend, while a reading below 20 suggests a weak or non-existent trend.
- Identifying the trend: If the ADX value is above 25, it indicates a potentially strong trend. If it is below 20, it suggests a lack of a clear trend. Traders should focus on securities with higher ADX values, as they are more likely to have a trending price movement.
- Confirming a trend: To validate a trend further, traders can use the Directional Movement Index (DX), which is derived from ADX. If DX is above 30, it is considered a strong trend.
- Determining trend direction: The ADX also provides information about the direction of the trend. A positive directional movement (+DI) above the negative directional movement (-DI) indicates an uptrend. Conversely, a -DI higher than +DI suggests a downtrend.
- Analyzing ADX crossovers: Traders can also use ADX crossovers to identify potential trend reversals. For example, if ADX crosses above 25, it may signal the start of a strong trend. Conversely, if ADX falls below 20, it may indicate the end of a trend.
- Using ADX with other indicators: To confirm signals or generate trading strategies, traders often combine ADX with other technical indicators, such as moving averages or oscillators.
It's important to note that ADX is not effective in volatile or choppy markets, as it works best in identifying strong trending markets. Therefore, it is essential to use ADX in conjunction with other technical indicators and analysis techniques to make informed trading decisions.
How to incorporate Average Directional Index (ADX) into a trading strategy?
The Average Directional Index (ADX) is a technical indicator used to measure the strength of a trending market. It helps to identify whether the market is trending or ranging and can be incorporated into a trading strategy in the following ways:
- Identifying Trending Markets: ADX can be used to determine whether the market is trending or ranging. A value above 25 is typically considered as a sign of a strong trend, while a value below 20 indicates a weak trend or a ranging market. Traders can use this information to focus on trading strategies suitable for trending markets, such as trend following or breakout strategies.
- Confirming Entry and Exit Points: ADX can be used to confirm entry and exit points for trades. For example, a trader may wait for the ADX to rise above a certain threshold, such as 25, to confirm a strong trend before considering entering a trade. On the other hand, a falling ADX may indicate a weakening trend and could signal an appropriate time to exit a trade.
- Combining with Other Indicators: ADX can be used in combination with other indicators to increase the accuracy of trading signals. For instance, some traders use ADX in conjunction with moving averages, where they only take long trade signals when the ADX is above 25 and the price is above the moving average. Similarly, they may only take short trade signals when the ADX is below 20 and the price is below the moving average.
- Avoiding Counter-trend Trades: ADX can also be used to filter out counter-trend trades. When the ADX is below a certain level, such as 20, it indicates a weak trend or a ranging market. In such cases, traders may decide to avoid taking trades that go against the predominant trend or focus on trading strategies suitable for range-bound markets, such as mean reversion or range breakout strategies.
- Setting Stop Loss Levels: ADX can help in determining appropriate stop loss levels. When the ADX is high, it indicates a strong trend, and traders may choose wider stop loss levels to allow for market volatility. Conversely, during low ADX periods, traders may opt for tighter stop loss levels, assuming there is less likelihood of significant market movements.
It's important to note that the ADX is a lagging indicator and does not provide information about the direction of the trend. Therefore, it is recommended to use it in combination with other technical indicators and price action analysis to develop a comprehensive trading strategy.
How to incorporate Average Directional Index (ADX) into a risk management strategy?
The Average Directional Index (ADX) is a technical indicator used to measure the strength of a trend. It can be incorporated into a risk management strategy in the following ways:
- Trend Identification: The ADX can help identify the presence and strength of a trend. Traders can use it to determine whether to enter a trade or not. A strong trend may indicate a higher probability of a successful trade, while a weak trend may suggest caution.
- Determine Stop Loss Levels: The ADX can assist in setting appropriate stop loss levels. Traders can place stop loss orders beyond key support or resistance levels based on the ADX reading. By doing so, they can protect their positions from volatility and limit potential losses.
- Exit Strategy: The ADX can help traders determine when to exit a position. If the ADX starts to decline after reaching a high level, it may indicate a weakening trend, and it could be a signal to exit the trade. This can help prevent losses from a potential trend reversal.
- Risk Allocation: The ADX can be used to allocate risk among different positions. Traders may assign a higher risk to trades with a strong trend, as they may have a higher probability of success. Conversely, trades with a weak trend may have a smaller risk allocation.
- Combining with Other Indicators: The ADX can be used in combination with other technical indicators to confirm signals and make more informed risk management decisions. For example, combining the ADX with a moving average crossover strategy can help identify potential entry and exit points with reduced risk.
It's important to note that while the ADX can be a useful tool in risk management, it should be used in conjunction with other risk management techniques and strategies to ensure a comprehensive approach. Additionally, traders should always continue to monitor market conditions and adapt their risk management approach accordingly.
How to use Average Directional Index (ADX) to identify range-bound markets?
The Average Directional Index (ADX) is a technical indicator that measures the strength of a trend in the market. It can also be used to identify range-bound markets, where the price is relatively stable and not trending strongly in any particular direction. Here's how you can use the ADX to identify range-bound markets:
- Determine the ADX value: The ADX value ranges from 0 to 100. A value below 20 typically indicates a weak trend or a range-bound market.
- Look for ADX declining or below 20: If the ADX is declining from a higher level or is consistently below 20, it suggests that the market is in a range-bound phase. This means that there is no strong trend in either direction.
- Analyze the ADX line and the +DI/-DI lines: The ADX line represents the overall strength of the trend, while the +DI and -DI lines represent the bullish and bearish components of the trend. In a range-bound market, these lines are likely to be close together and not showing a clear bias.
- Look for support and resistance levels: In a range-bound market, prices tend to oscillate between support and resistance levels. Identify these levels and observe how the price reacts when it approaches them. If there is no significant breakthrough, it suggests a range-bound market.
- Consider using other indicators: While the ADX can indicate range-bound markets, it is always helpful to use other indicators to confirm the analysis. Trend-following indicators like moving averages or oscillators like the Relative Strength Index (RSI) can provide additional insights.
Remember, no indicator is perfect, and market conditions can change quickly. Therefore, it is important to continuously monitor the ADX and other indicators to stay updated on market trends and adjust your trading strategies accordingly.
What are the key components of Average Directional Index (ADX)?
The key components of the Average Directional Index (ADX) are:
- Positive Directional Index (+DI): This component measures the strength of the positive trend or buying pressure in the market.
- Negative Directional Index (-DI): This component measures the strength of the negative trend or selling pressure in the market.
- True Range (TR): The true range calculates the volatility or price movement between the high and low of a given period. It considers any potential gap that occurred between periods.
- Average True Range (ATR): The average true range is the average of the true range over a specified period. It helps smoothen out the price volatility and provides a more accurate measure of market movement.
- Directional Movement (DX): The directional movement is calculated by dividing the absolute difference between +DI and -DI by the sum of +DI and -DI, which is then multiplied by 100 to get a percentage. It indicates the strength of either positive or negative price movement.
- Average Directional Index (ADX): The ADX is obtained by smoothing the DX value using an exponential moving average. It provides a single value that represents the overall trend strength in the market. A higher ADX indicates a stronger trend, while a lower ADX suggests a weaker or sideways trend.
